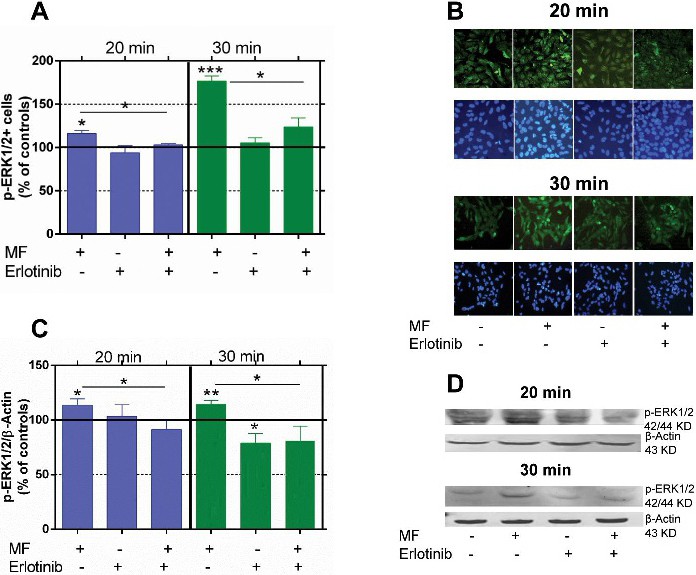
Fig. 3. Effects of 20- or 30-minute MF exposure on the rate of p-ERK1/2+ cells and on p-ERK1/2 protein expression, in the presence or absence of the inhibitor of EGFR phosphorylation, erlotinib. Four experimental conditions were assayed: -/-: untreated controls; +/-: MF only; -/+: erlotinib only; +/+: MF plus erlotinib. (A) Immunofluorescence quantification by computer-assisted analysis of photomicrographic images. Means ± SEM of 3 experimental replicates, with 4 samples per replicate and experimental condition. Normalized values.*: 0.01 ≤ p<0.05; ***: p<0.001 (ANOVA and Student's t-test). (B) Upper panel: representative images of p-ERK1/2 labeling (green) at the two studied intervals and under the corresponding experimental conditions. Lower panel: Hoechst-stained nuclei of the cells in the corresponding upper micrographs. (C) Western blot quantification of p-ERK1/2 expression, using β-Actin as load control. The values, normalized over the corresponding sham-exposed controls are means ± SEM of 5 experimental replicates, with 3 samples per replicate and experimental condition. *: 0.01 ≤ p <0.05; **: 0.001 ≤ p <0.01 (Student's t-test). (D) Representative blots.